
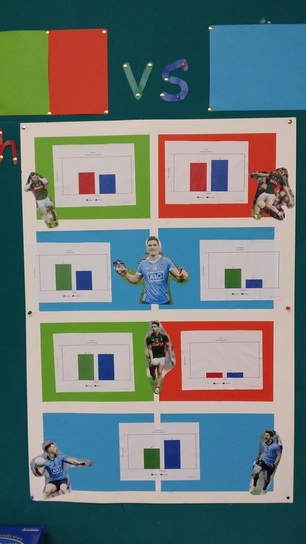
Last week we learned about Data collection, Statistics averages and how to present our findings. On Friday we put our learning to use. We watched the Sunday Game highlights of Dublin V Mayo the drawn game. In groups we recorded the numbers of handpasses, frees, tackles, turnovers, kickouts, scores and kickpasses for each team. We recorded the data using a tally system and presented our findings using multiple bar charts. The results of each can be seen in the bar charts below. It was a very interesting way to look at the game. We can see that it is a very intense job and the person doing this job on a match day has a very responsible job.
|
| ||||
|
| ||||
|
| ||||
| chart_turnovers.pdf |
 RSS Feed
